QualityOne Vaults allow you to view plotted graphs of inspection data for material assessment and quality control improvements. When assessing whether a material quality and manufacturing process needs additional action for improvement, you can use a control chart to visualize related Inspections data on a Material record. Depending on your permissions, you can view and run filters to generate a control chart for Material records.
Depending on your Admin’s setup, object, field, and section labels may appear differently than the labels mentioned in this article.
Note: As of 22R1, Control Charts are no longer available for Product records.
Control Chart Details
A control chart consists of the following details, plots, and lines that represent Material data:
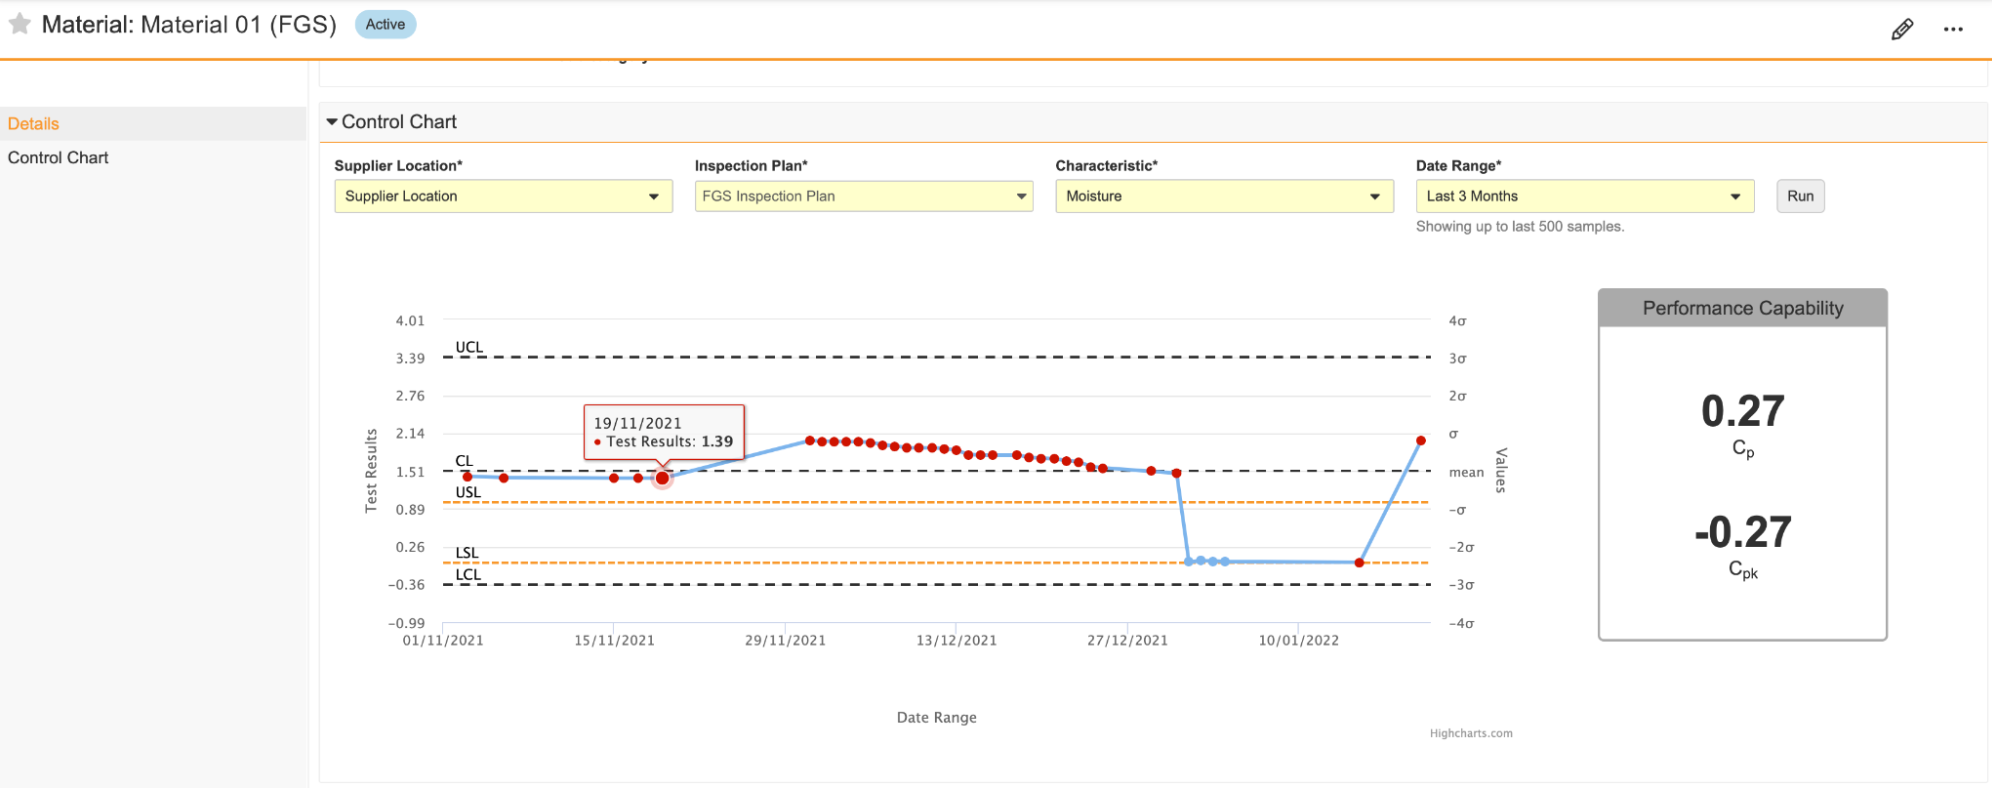
- USL and LSL orange dotted lines:
- Upper Specification Limit and Lower Specification Limit.
- The threshold limits are considered to be the highest and lowest specification that is still acceptable to customers.
- This is based on the selected Inspection Plan and Characteristic filters.
- UCL and LCL grey dashed lines:
- Upper Control Limit and Lower Control Limit.
- The threshold limits are considered to be the highest and lowest level of quality acceptable for a material.
- These are based on the plotted data points and are three (3) standard deviations from Central Line.
- CL black dashed line:
- Central Line.
- The mean value of the plotted data points.
- Blue dots:
- Represent values from Test Result (Variable Data) type Inspection Sample Test Result records for the applicable Material that align with the selected control chart filters.
- Clicking on a blue dot in the control chart opens the corresponding Inspection Sample Test Result record in a new browser tab.
- Performance Capability chart:
- Cpk (performance) and Cp (capability) ratios help to illustrate a process’ ability to meet specifications.
- Cpk is calculated by the minimum of Cpl (Cpk LSL) and Cpu’s (Cpk USL) average. The minimum average is calculated by subtracting the mean and dividing it by three (3) standard deviations.
- Cp is calculated by subtracting LSL from USL and dividing it by six (6) standard deviations.
Control Chart Filters
The Control Chart section contains four (4) required filters that narrow the scope of your control chart:
- The Supplier Location or Facility filter:
- Displays as Supplier Location if the Procurement Type field value on the Material record is blank or Purchased, and displays as Facility if the Procurement Type field value is Manufactured.
- Populates any Inspection Sample Test Result records that meet the following criteria as data points on the chart:
- The Material on the associated Inspection record matches the Material for which you are generating the control chart.
- If the Supplier Location filter displays, the selected Supplier Location value matches the Supplier Manufacturing Site field value on the Inspection record associated with the Inspection Sample Test Result. If the Facility filter displays, the selected Facility value matches the Facility field value on the Inspection record associated with the Inspection Sample Test Result.
- The Inspection Plan filter:
- Displays Inspection Plan values associated with the Material record.
- Displays USL and LSL from the Inspection Plan to specify limit boundaries on the chart.
- The Characteristic filter:
- Depends on the Inspection Plan filter.
- Displays Characteristic values associated with the Inspection Plan object record.
- Populates any Inspection Sample Test Result record associated with the selected Characteristic as a data point on the chart.
- The Date Range or Sample Count filter:
- Displays Date Range or Sample Count values, depending on your Admin’s configuration.
How to Generate a Control Chart
To generate a control chart for a Material record:
- Navigate to the Control Chart section on the appropriate Material.
- Choose a Supplier Location or Facility from the filter.
- Choose an Inspection Plan from the filter.
- Choose a Characteristic from the filter.
- Choose a Date Range or Sample Count from the filter.
- Click Run. This generates a control chart to match your filters. Repeat the process to generate different control charts with different filters.
You must regenerate the control chart each time you reopen the Material record.